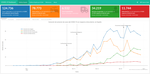
Learning data science with COVID19
I confess: during these days of lock down, I have toying with dashboards and infographics about COVID19 outbreak, just like everyone else. And I am not ashamed to admit that I am proud of the results I have achieved: I have made an interactive dashboards with nice plots, some formatted tables and even some (basic) maps. Everything with a few lines of code1. And yet, it is flawed. And yet, I will keep improving it.
Reeling in the Years. 12 Years are Nothing (or Perhaps they Are)
It’s nothing new to say that buildings age over time. Or that, like people, they can age well or not so well. José María Echarte wrote an article in this blog about how to age well (and how to appreciate age). Today I want to talk about just the opposite.
A few days ago, I wanted to show some friends a building. We’d had a reunion and were in the neighbourhood, so I wanted to grab the opportunity to go with them to take a look at a building they hadn’t yet been able to see.

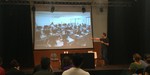
Looking for the 'perfect' presentations' solution (for me)
During the last 10 years I have given a number of talks in various contexts due to my job as a lecturer: either lectures for my students, conferences, workshops or even much more informal events, usually speaking about cities, commons, maps or accessibility. I enjoy it because I love sharing knowledge with others but also because it is when I am preparing presentations (by summarising and highlighting the main topics or thinking of the storytelling) where I reflect and learn the most.
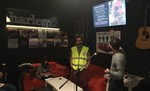
Digital Privacy Workshop: a chronicle
In this post I will share my experience as attendee to Reconfigure Workshop. Reconfigure is a group of feminist cybersecurity advocates & researchers seeking to engage with groups excluded from tech and improve industry and academia

'The Three Little Pigs' is a Fairy Tale
«Once upon a time there were three little pigs who lived in a wood. The big bad wolf was always chasing them and trying to eat them, so one day the eldest said, “We have to build a house to protect ourselves from the wolf. Then we could hide inside it every time he comes round.”»
We all know how the story of those three little builder pigs continues.

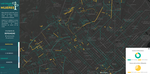
A brief note on maps and feminism
As those who know me well know, I love maps: I like to see them, I like to make them and I like to use them to give answers to complex questions. I like the fact that you can create maps about almost anything. But surely, what I like most about them is that they are unique tools to show unnoticed realities that help to understand all types of phenomena. Some common (and, to some extent, hackneyed) examples of such maps are those used to explain the spread of diseases1, the distribution of energy consumption, social inequality, or gentrification.
'Accessible Zaragoza' at Pint of Science 2018
Let me propose an exercise: close your eyes for a moment and imagine a person devoted to science and research. Almost certainly, you may have visualized a middle-aged man in a white robe and glasses who is doing “things” in a laboratory or in front of a computer, probably to solve a problem related to health, the environment or making a process more efficient. If I have “read your mind” it is not because you are a predictable person, but because that is (with small variations) the most frequent image about scientists.
'Accessible Zaragoza' is now on TV
During the last few years, I have hardly shown any activity on this website. This is because they have coincided with periods of considerable intensity, especially in terms of work. I already wrote about one of the main reasons, and today I would like to write about another other one: Accessible Zaragoza, the collaborative mapping project of aspects related to urban mobility and disability that I devised in the academic year 2015-16 within a chair at the Universidad San Jorge and in which I have been working as a principal investigator since then.
IND+I Science award to Metropolitan Innovation Policies
Although it had officially been announced several days ago, the IND+I Science1 awards ceremony took place yesterday, where I received the prize of the category “Metropolitan innovation policies” for my doctoral research on urban commons.
About Simplicity, Complexity and Deficiencies
There are two ways of constructing a software design: one way is to make it so simple that there are obviously no deficiencies; the other is to make it so complicated that there are no obvious deficiencies. – C. A. R. Hoare
When reading A byte of python by Swaroop C H, I found this quote being funny, well constructed and true. The funniest thing in my opinion is that it can also be applied to many other areas apart from computer science, being politics one of the most evident.